Five metrics that predict a late project weeks in advance
We analysed 4,000 teams. These are the early signals that a deadline is in trouble.
Lumetric connects the tools your teams already use and turns them into live dashboards, honest forecasts and reports that write themselves.

Trusted by 4,000+ product and engineering teams
Dashboards, forecasts, workload and goals share one data model, so every number agrees with every other number.
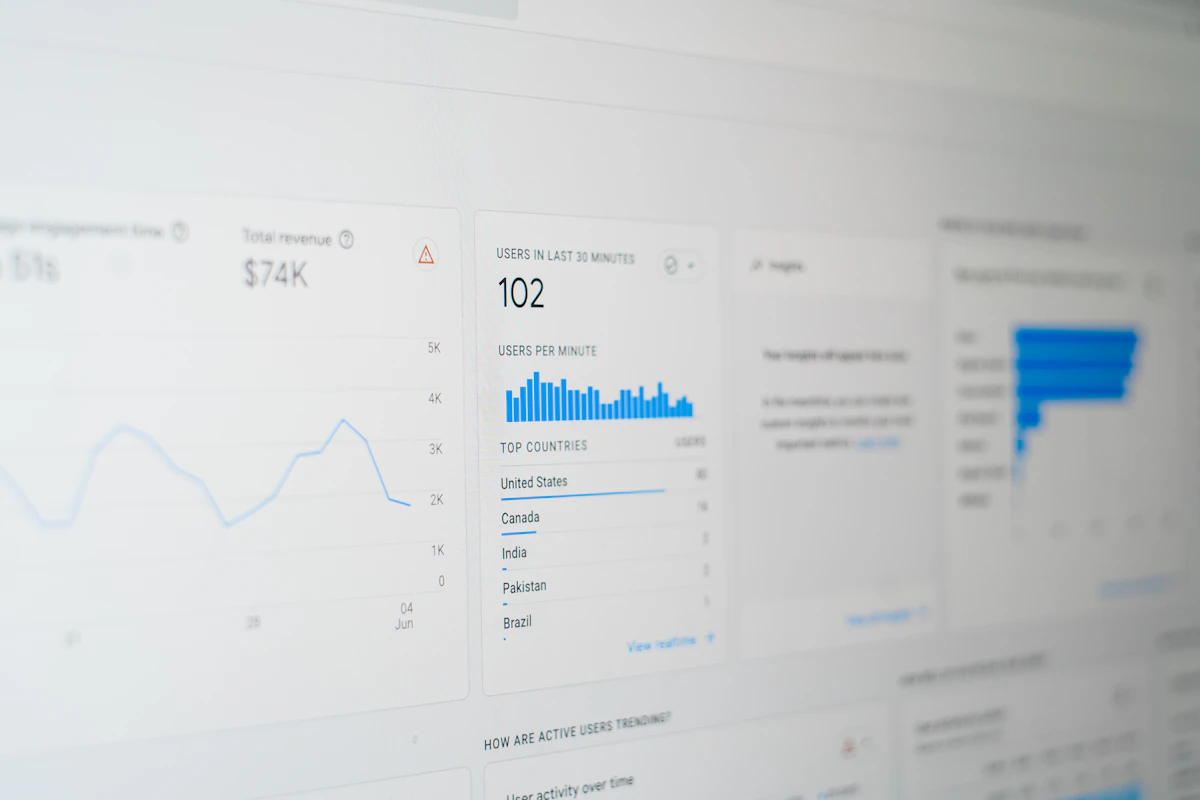
Refreshed every 30 seconds from your issue tracker, code and deploys.
Releases land within a week of the forecast.
Stuck reviews and scope creep, flagged before they hurt.
We cancelled our Monday status meeting in week three and nobody has asked for it back.
Dana WhitfieldVP Engineering, Kestrel HealthSee who is overloaded and rebalance in one click.
From sign-up to first dashboard.

Link key results to real work.

Start from templates for engineering, product or leadership, then drag in the widgets that matter to you.

Monte Carlo simulations use your real throughput to predict when work will land, with a confidence level attached.

Capacity scores combine tickets, reviews, on-call and meetings so you can spot overload early.

Scheduled summaries land in inboxes and chat channels with the numbers that changed and why.

Connect your issue tracker, Git host, CI pipeline and calendars with a few clicks. No scripts, no data engineering.

Lumetric maps every workflow to one model and highlights the bottlenecks, from waiting reviews to growing scope.

Set goals, track progress automatically and share results with leadership in a report that builds itself.
Sixty native connectors plus an open API and webhooks for everything else.
Sync tickets, sprints, epics and custom fields.
Pull requests, reviews and merge times.
Builds, deploys and change failure rate.
Alerts and digests in the channels you use.
Time off, meetings and on-call rotas.
Export everything or query it with SQL.
SAML, SCIM and every major identity provider.
Build your own connectors and automations.
Lumetric replaced three spreadsheets and a weekly meeting. Our leads finally talk about problems instead of hunting for numbers.
The forecasts are scarily accurate. We now plan launches with confidence ranges and our sales team loves it.
Setup took one afternoon. By the next morning we had dashboards for fourteen squads, no consultants needed.
Start free, upgrade when your team is ready. Every plan includes unlimited dashboards.
For a single team getting started.
For product orgs with several teams.
For large companies with complex needs.
Can't find what you need? Our team replies within two hours on weekdays.
 Delivery
We analysed 4,000 teams. These are the early signals that a deadline is in trouble.
 Leadership
A four-week plan to replace the weekly update with something your team will actually read.
 Forecasting
Why a date range beats a single date, and how simulations turn history into honest plans.
30 ready-made demos
Colour scheme
Your choice is remembered on this device.