Live dashboards
Every project, sprint and release on one screen, refreshed the moment work moves.
Learn moreMonte Carlo forecasts built on your team's real throughput, not guesses.
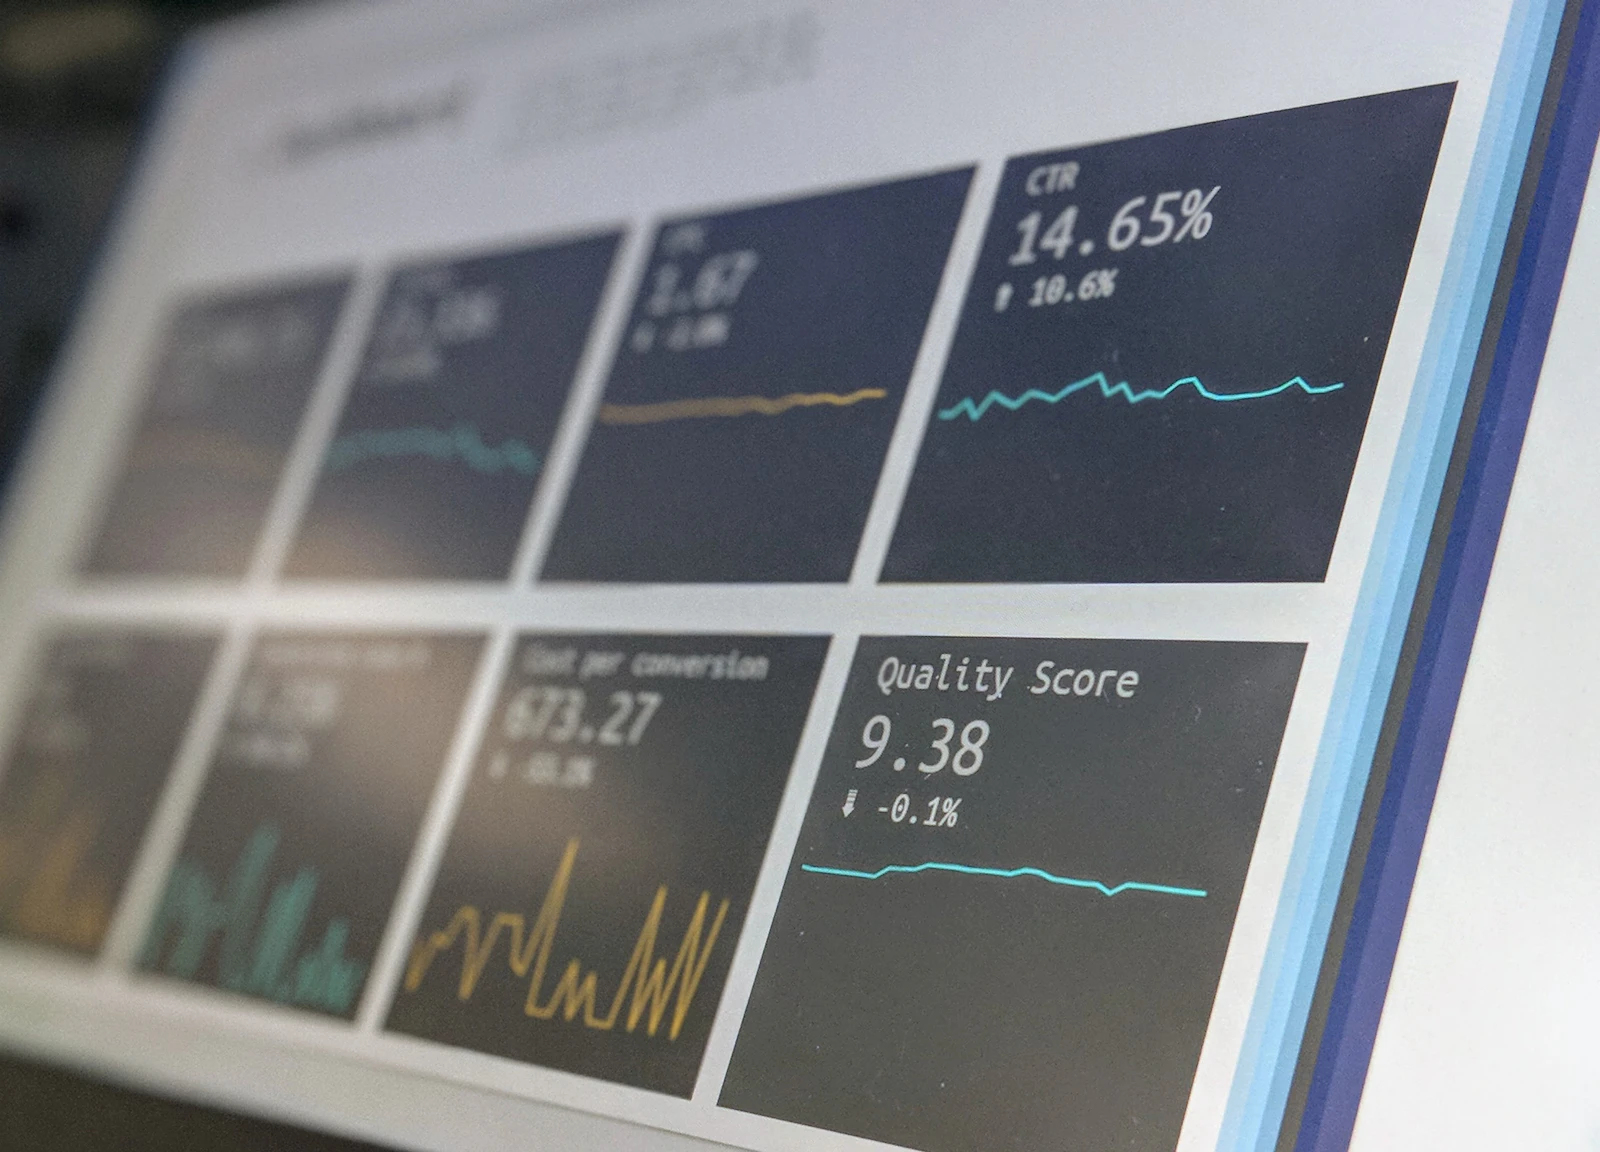
Estimates are optimistic by nature. Lumetric looks at how much work your team finishes each week, how often scope grows and how long reviews wait, then runs ten thousand simulations to show the likely delivery date.
You get a date range with a confidence level, a chart of what is pushing it out and a heads-up the moment the forecast slips. Product managers stop chasing updates, and leadership stops being surprised.
See the 50%, 85% and 95% confidence dates side by side.
Spot the tickets that were added after kickoff.
Add a developer or cut a feature and watch the date move.
Get a message when a forecast moves by more than two days.
30 ready-made demos
Colour scheme
Your choice is remembered on this device.